“All models are wrong
but some are useful.”
George E.P. Box
In biology, you cannot really “prove” anything let alone the “true” shape of the proper dose-response curves. Other issues of importance are:
“All models are wrong
but some are useful.”
George E.P. Box
In biology, you cannot really “prove” anything let alone the “true” shape of the proper dose-response curves. Other issues of importance are:
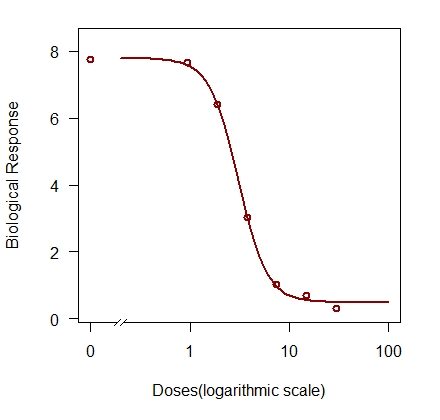
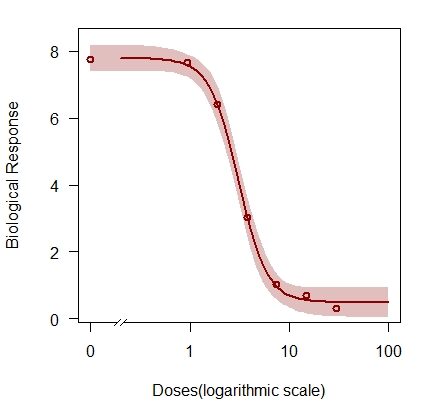
Figure 1. The general dose–response curves (left) and with confidence intervals (right). The mean responses are within the 95% confidence inerval estimates (right). Nevertheless, the confidence interval is unique because it only represents one experiment.
Figure 1 illustrates a general do-response curve and its confidence interval. Please note that the smallest 95% confidence band intervals are in the middle of the curve. As mentioned in the legend, these confidence intervals are unique; they only represent the parameters in this single experiment. Consequently, toxicity bioassays must be replicated in time and space to get “more true” confidence intervals that can be used in practice.
One of the problems that non-statistical scientists were facing in the past was that guestimates of nonlinear regression parameters had to be provided upfront before any estimation of parameters could take place. It is an insuperable problem for many practitioners. To a large extent, this problem has now been resolved in the package drc by using the so-called self-starter function.
The development of dose-response analysis has undergone dramatic changes, from struggling with cumbersome more or less manual calculations and transformations with pen and paper to the blink-of-an-eye estimation of relevant parameters on any laptop.